
Let’s take a look at a case study of how a global healthcare manufacturer boosted Sales with Movate’s flu outbreak prediction solution using GCP.
Background
The client is a global healthcare manufacturer organization that supplies specialty care, vaccines, and generic medicines to over 170 countries with manufacturing sites across 32 countries.
To proactively address supply chain constraints, the customer’s goal was to create a predictive global vaccine demand model, which would integrate data from flu occurrences, online behavior, vaccine rates, demographic attributes, and other disparate systems and present it into an integrated dashboard. The objective was to leverage data-driven insights to accurately map, anticipate vaccine demand, and stay ahead in the dynamic healthcare landscape.
Key Business Challenges
The client engaged Movate to solve the following business challenges:
- Sub-optimal vaccine uptake resulting in decreased sales: Despite vaccine availability, low uptake rates among target populations negatively impacted vaccine sales and distribution, reducing vaccination rates and potentially increasing disease outbreaks.
- Limited visibility and predictability of patient behavior and flu outbreak patterns: Challenges in accurately predicting patient behavior and flu outbreak patterns resulted in insufficient vaccine distribution and sub-optimal supply and demand management.
- Integration and analysis of unstructured data from complex internal and public datasets: The healthcare industry encountered challenges in consolidating and analyzing diverse and complex data from multiple sources to gain comprehensive insights into factors influencing vaccination patterns and outcomes.
- Skepticism to embrace new business models & emerging tech – AI/ML & analytics: Resistance towards adopting new business models and emerging technologies, such as artificial intelligence, machine learning, and analytics, was impeding the healthcare industry’s ability to effectively leverage advanced tools and techniques for optimizing vaccination efforts.
Solution | Developing a scalable and high-performing data analytics platform in GCP
While developing a scalable and high-performing data analytics solution on the Google Cloud Platform, we encountered two sets of broad requirements, with processes playing a critical role.
The first challenge involved collecting data from diverse sources, building a robust data pipeline, and storing the data in a data lake. The second challenge was of data cleansing, which was complex as it involved generating the desired outcome and preparing the dataset for prediction. To address these challenges, we leveraged various managed services provided by Google, integrating them to build a comprehensive and scalable data analytics platform.
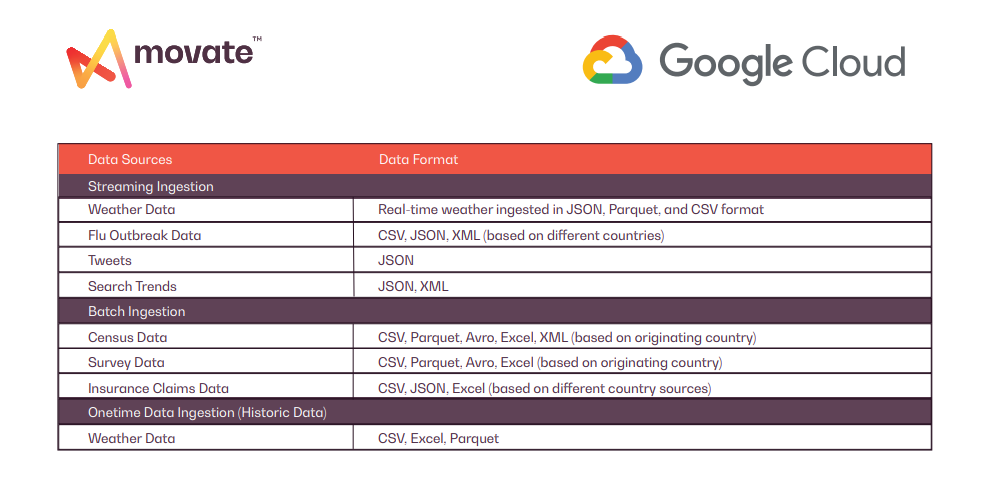
Input Data Formats
To handle disparate data sources and data-originating patterns, we designed the data ingestion layer to handle both streaming and batch data. The following data formats were handled at the ingestion level:
Data Transformation
The data analytics platform was built on Google Data Prep to transform and store input data in the data lake effectively. We used Dataproc for Apache Spark, a managed Spark service on GCP, which performs large-scale data processing tasks for batch data ingestion.
Additionally, we utilized Dataflow ETL, a managed data integration service on GCP, for stream data ingestion, enabling the environment to process and transform data in real time as it flows into the platform. These robust tools provided the data analytics platform with the flexibility, scalability, and reliability needed for efficient data transformation and storage in the data lake, ensuring the data is ready for further analysis and insights generation.
Data Mining and Exploration
The data analytics platform utilized Google Datalab for interactive data exploration and analysis. Datalab also provided a collaborative and interactive environment to run notebooks and conduct exploratory data analysis. To manage and access the data stored in the data lake, we utilized Data Catalog, a fully managed metadata management service on GCP, making it easy to discover and understand relevant data for the analytics tasks. Dataflow ETL, a managed data integration service on GCP, efficiently processes and transforms data in real-time or batch mode, enabling us to extract valuable insights from the data.
The combination of Google Datalab, Data Catalog, and Dataflow ETL empowered the organization with the flexibility, scalability, and reliability needed for effective data mining and exploration. With this, we uncovered hidden patterns, trends, and insights from the data, driving data-driven decision-making in the analytics platform.
Machine Leaning (ML) Engine and Prediction:
The data analytics platform used GCP Machine Learning algorithms to predict flu outbreaks based on the vast amount of data stored in the data lake. Our team utilized supervised learning, time series analysis, and anomaly detection to build robust predictive models. We employed data preprocessing and feature engineering techniques using tools like Data Prep and Dataflow ETL to prepare the data for model training. We utilized GCP’s machine-learning libraries for model development and training, including TensorFlow, Scikit-learn, and XGBoost.
Additionally, we used AutoML, a powerful automated machine learning service on GCP, to accelerate the model development process and generate high-quality models with minimal manual intervention. Once the model was trained, we deployed them on GCP’s ML Engine for scalable and reliable prediction. The predictive models enabled us to forecast flu outbreaks and even detect potential outbreaks up to 3-weeks in advance, providing critical data-driven insights and allowing the organization to anticipate vaccine demand effectively.
Dashboard and Visualization
To provide a comprehensive visualization of worldwide flu statics and identify regions with potential flu outbreaks in the next 3-weeks, we leveraged Looker, a powerful Business Intelligence (BI) and data visualization tool. With Looker’s interactive filters and drill-down capabilities, the client was able to explore the data from different angles and levels of granularity. We employed various visualization techniques, including line charts, bar charts, heat maps, scatter plots, choropleth maps, and tables, to effectively present the data visually appealing and meaningfully. For example,
- We used choropleth maps to visualize the country-wise flu predictions.
- Line charts illustrated the patient’s journey over time.
- Heat maps showcased geographic patterns.
- Scatter plots depicted the correlations between vaccine demand and other variables.
The integrated dashboard empowered the organization to make informed decisions, proactively anticipate vaccine demand, and overcome supply chain constraints.
Outcome | Insight-Driven Action
- Informed Decision Making: Leveraged a predictive model that accurately predicts flu outbreaks 3 weeks in advance and recommendations to identify enablers that drive flu vaccine acceptance, allowing for proactive decision-making and resource allocation.
- Targeted Advertisement Campaigns: Utilized real-time trends in online search data to select relevant ad words and topics, enabling targeted communication and advertisement campaigns to reach the desired audience effectively.
- Maximize Vaccine Acceptance Rates: Mapped online topics to online patient behavior, enabling initiatives to educate and create public awareness about any potential side effects of vaccines and address apprehensions, leading to increased vaccine acceptance rates.
- Improved Sales Margins: Utilized insights from patient segmentation and flu outbreak predictions to anticipate vaccine demand, enabling effective supply-demand balancing and improved sales margins by up to 5% through optimized vaccine uptake and inventory management.
- Customized Analytical Model: Developed a reusable analytics framework that included a real-time dashboard with self-service visualizations for the key decision-makers, reducing the overall cycle time from data collection to insights and providing customized analytics for informed decision-making.
Conclusion
In conclusion, Movate’s solution, powered by managed services from Google Cloud, enabled the healthcare manufacturer organization to leverage the power of data-driven insights, predict flu outbreaks, and overcome supply chain constraints. The organization achieved self-service visualizations by building a reusable analytics framework and a real-time dashboard while reducing the overall cycle time from data collection to insights. Overall, our platform built using Google Cloud managed services, provided a scalable and reliable solution to map and anticipate vaccine demand in the dynamic healthcare landscape.
If you are looking for similar analytics use cases in GCP, please contact us today.