



“We reduced our average resolution time.”
It sounds like progress. But sometimes the average is the very metric preventing you from finding the real problem. Across the support operations I have reviewed over the years, spanning banking, telecom, retail, insurance, and technology, one pattern keeps repeating: teams celebrate improvements in the average while customers keep experiencing long delays. The reason is simple. Averages assume every case behaves the same way. Operational data rarely does.
1. The Illusion of the Average
Consider a support queue with 1,000 resolved cases, generated here from a synthetic but realistic mix of fast, moderate, and severely delayed tickets:
- Around 70% of tickets are resolved within one hour.
- The median resolution time, the “typical” case, is only 44 minutes.
- Yet the average resolution time is 24.3 hours, more than a full working day.
At first glance, these numbers seem contradictory. They aren’t. A small number of extremely delayed cases are stretching the average far beyond what most customers actually experience.
The average is describing the arithmetic. The median is describing reality.
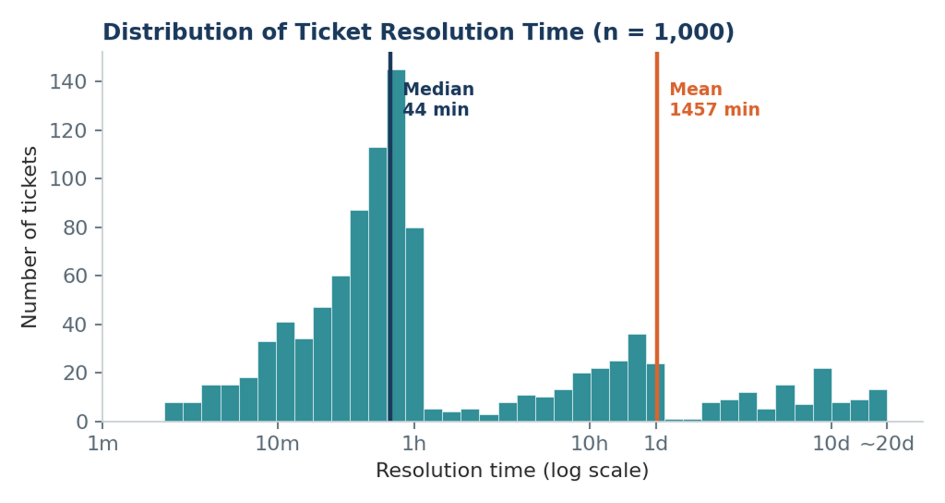
Figure 1. Ticket resolution times cluster near the median, but a long right tail pulls the mean far above it.
2. Where Is the Delay Really Coming From?
When the same 1,000 tickets are segmented by resolution time, the picture becomes much clearer:
| Resolution Time | % of Tickets | Share of Total Waiting Time |
| Within 1 hour | 70% | 1% |
| 1 hour to 1 day | 19% | 9% |
| 1 to 10 days | 8% | 43% |
| More than 10 days | 3% | 46% |
Just 11% of tickets, the ones taking more than a day, account for 89% of all waiting time. If the objective is to reduce the average, improving the already-fast 70% will barely move the needle. The real opportunity lies in understanding, and fixing, the long tail.
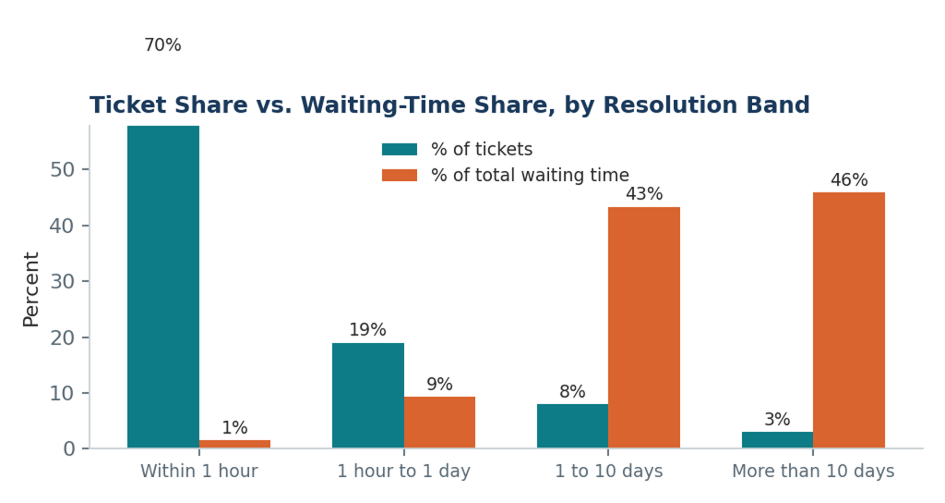
Figure 2. A small minority of tickets accounts for the overwhelming majority of total customer waiting time.
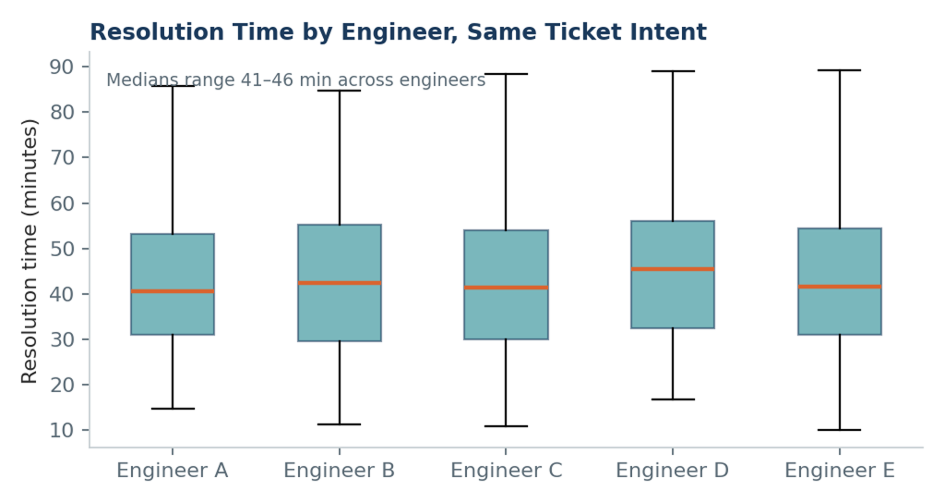
Figure 3. Five engineers, same ticket intent: medians cluster between 41 and 46 minutes, with heavily overlapping ranges.
3. Not Every Delay Is an Agent Problem
The next instinct is usually to compare engineers or agents. We did exactly that. After comparing five engineers handling the same ticket intent, there was no meaningful difference in performance.
The variation wasn’t primarily driven by who handled the ticket. It was driven by what kind of ticket they handled. This distinction matters: when we blame individuals for what is actually process variation, coaching becomes expensive and ineffective.
4. Compare Like with Like
One operational category looked healthy in March but deteriorated noticeably by May. At first glance, the average resolution time had simply increased. A deeper look told a richer story: the median resolution time roughly doubled, and a new, heavier tail of severely delayed cases appeared that was not present in March.
Because ticket volume remained almost unchanged, this wasn’t a capacity problem. Something in the process had changed: possibly additional approval steps, routing delays, customer waiting periods, new operational procedures, or tooling changes. The average only told us performance declined. The distribution helped explain why.
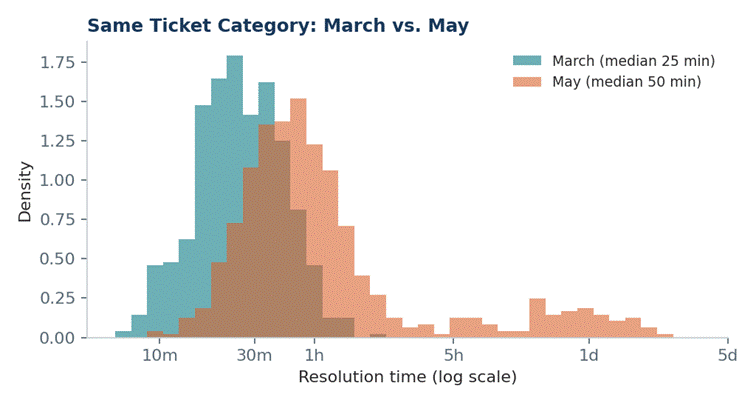
Figure 4. Same ticket category, two months apart: median resolution time moved from 25 to 50 minutes, and a new delayed tail emerged in May.
5. The Transfer Effect
Another pattern appears repeatedly in technical support environments. Overall resolution time may look reasonable until tickets are separated by how many times they were transferred between teams. Tickets resolved by the first owner closed several times faster than transferred cases, and each additional transfer added further delay. The lesson wasn’t that engineers suddenly became slower. It was that handoffs create delay: every transfer introduces waiting time, coordination effort, ownership changes, and customer uncertainty. Reducing unnecessary transfers often delivers far greater improvement than asking engineers to work faster.
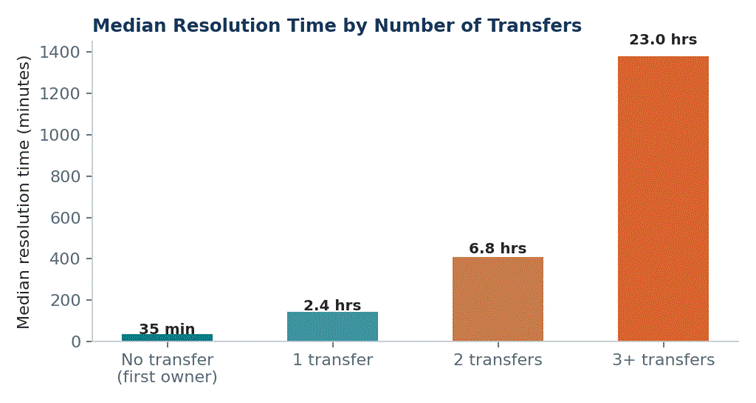
Figure 5. Median resolution time compounds with each additional handoff between teams.
6. Question the Average: A 7-Point Checklist
Before accepting any reported average as a description of performance, run it through these seven checks. The first two map directly to the examples in this article: a median far below the mean, and an average that shifts depending on which time window you measure.
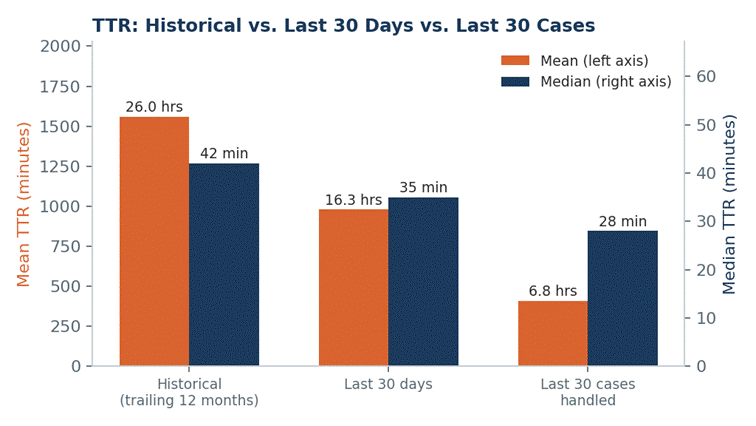
Figure 6. The same operation, three windows: mean and median both shrink as the window narrows from historical to the last 30 cases handled, and the gap between them narrows too.
and the gap between them narrows too.
| Check | Ask This | What It Reveals |
| Median vs. Mean Gap | Is the mean much larger than the median? | A wide gap signals skew, not typical performance. On this dataset: mean 24.3 hrs vs. median 44 min, on the same 1,000 tickets. |
| Time-Window Comparison | How does the historical average compare to the last 30 days, and to just the last 30 cases handled? | A number that moves a lot between windows is reacting to something recent, not describing a stable state. |
| Percentile Spread | What do the 50th, 90th, and 99th percentiles say that the average doesn’t? | Shows how bad the worst cases really are. Here, P90 is 54.3 hours and P99 is 16.9 days, both far past the 44-minute median. |
| Segment by Category | Does the average change materially when split by ticket type, product, or issue? | A blended average across dissimilar categories hides which one actually needs attention. |
| Segment by Ownership | Is the average different for first-owner-resolved vs. transferred cases? | Reveals whether handoffs, not effort, are driving the number. |
| Sample Size Behind the Number | How many cases is this average built on? | A small sample can be swung entirely by one or two outliers. |
| Trend, Not Snapshot | Is the average, and the shape of the distribution behind it, improving, stable, or degrading week over week? | A single snapshot cannot tell you if you are looking at a blip or a trend. |
Conclusion:
Support organizations don’t improve because dashboards become prettier. They improve because analytics identifies where intervention will create the greatest business impact. Sometimes that means redesigning routing. Sometimes it means reducing transfers. Sometimes it means automating approvals. Sometimes it means focusing entirely on the small fraction of cases creating the majority of customer waiting time.
The objective of analytics is not to summarize performance. It is to help leaders decide where to act next.
The next time someone tells you the average has improved, ask one more question: “What does the distribution look like?” You may discover that the real story has been hiding in the tail all along.
| COE PRACTITIONER’S PRINCIPLE Operational metrics should be designed to support decisions, not just describe performance. Median, percentiles, Pareto analysis, and segmentation often reveal improvement opportunities that averages simply cannot. |

Dr. Kiran Marri leads the company’s innovation and digital transformation initiatives. With over 25 years of experience spanning technology, research, and applied innovation, Dr. Marri is recognized for harnessing cutting-edge technologies—including AI and generative AI—to solve complex, real-world challenges for clients across industries.
A prolific thought leader, Dr. Marri has authored more than 80 publications in leading conferences and journals, and his work has earned eight award-winning research papers across software engineering, biomedical engineering, analytics, and machine learning. His visionary approach continues to position Movate at the forefront of transformative, AI-driven solutions.